

Somebody sends you a screenshot with a green 98 on it. The implication is that the website is fast.
What it actually demonstrates is that a simulated load, on assumed conditions, on a machine you have never seen, produced a good result. Whether your customers experience anything similar is a separate question the screenshot does not answer.
A Lighthouse score is a useful diagnostic and a poor proof. Knowing the difference is most of what you need to work out how to improve Lighthouse score without wasting effort on the wrong fix.
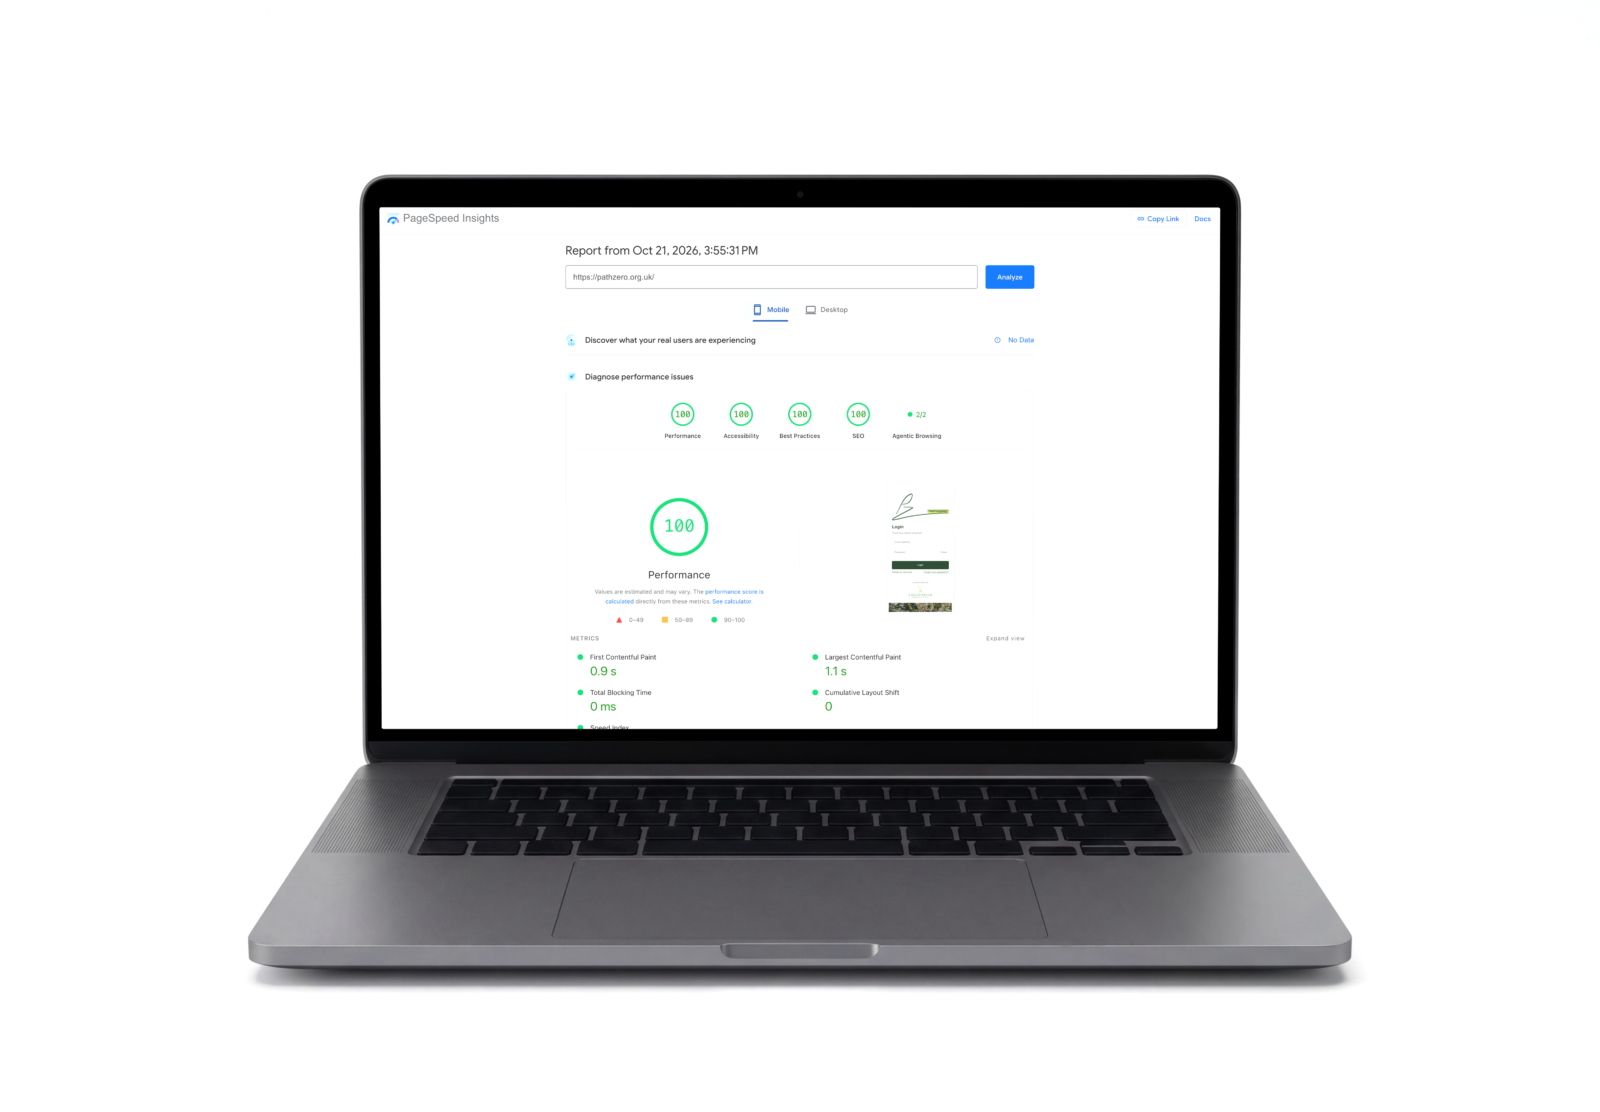
What a Lighthouse score actually measures
Lighthouse’s variability documentation says the typical end user uses simulated throttling. Simulated throttling replays network activity and caps the theoretical execution time of CPU tasks, so your page is loaded once, in a controlled environment, and scored against assumed network and processor conditions. Then the result is scored and suggestions are listed.
The controlled environment is the point. Consistency makes it repeatable, which is what makes it useful for comparing a page before and after a change.
It is also what makes it unrepresentative. Your visitors are not a controlled environment. They are on varying devices, varying connections, in varying conditions, with varying amounts already cached. A high Google Lighthouse score tells you the test conditions were favourable. It does not tell you your visitors’ conditions were.
An average Lighthouse performance score of 96 across twelve client sites. We still start every project from field data rather than the lab number, because the two answer different questions. If you want to see where your own site’s lab score and real-user data diverge, a free website carbon audit checks both at once.
Lighthouse performance metrics, weights and score bands
The Lighthouse score is not one measurement. It is a weighted average of five Lighthouse performance metrics, each converted to a score from 0 to 100 first. In the version 10 scoring table that Chrome publishes, the weights are:
- Total Blocking Time (TBT): 30%
- Largest Contentful Paint (LCP): 25%
- Cumulative Layout Shift (CLS): 25%
- First Contentful Paint (FCP): 10%
- Speed Index (SI): 10%
The weights in the current Lighthouse source code match that table. Chrome’s scoring page also carries an older table, so check which version produced the report you are reading.
The practical consequence is that nearly a third of the score rests on one metric, TBT, and more than half rests on TBT and LCP together. Chrome describes LCP as measuring when a user perceives that the largest content of a page is visible. A page can look quick in the first second and still score poorly if the main thread is busy afterwards.
The colours in the report follow three bands:
- 0 to 49 (red): poor
- 50 to 89 (orange): needs improvement
- 90 to 100 (green): good
Chrome’s scoring guide also describes a score of around 96 as the point of diminishing returns. Beyond it, the extra effort buys very little.
These bands apply to a lab score. They are not the Core Web Vitals thresholds, which apply to field data and are covered in the web.dev guidance on Core Web Vitals.
How to read the Lighthouse performance report
Run Lighthouse in Chrome DevTools or paste an address into PageSpeed Insights, and you get the same shape of report. Read it in this order.
The score at the top. One number, coloured by the bands above. It is a summary, not a verdict.
The metrics. These are the five measurements behind the number, and only these contribute to the Performance score. Opportunities and Diagnostics do not.
Opportunities. Chrome describes this section as detailed suggestions, with documentation on how to implement them. It is where fixes come from.
Diagnostics. Additional guidance you can explore to improve performance further. Useful, but a fix here will not move the score directly.
When you work out which metric is dragging the number down, that tells you which part of the Opportunities list to read first.
Why the numbers move when nothing changed
Run Lighthouse several times on the same page and the scores can differ, even when nothing about the page has changed. Lighthouse’s own documentation says performance scores will change because of inherent variability in web and network technologies.
Server load varies. Network conditions vary. The machine running the test has other work happening. Third-party scripts respond at different speeds on different runs.
This variability is not a defect. It is what happens when you measure a single load of a complex system. It does mean a small difference between two runs may be noise, and treating it as an improvement is a mistake people make regularly when chasing Lighthouse performance optimisation as a numbers game rather than a diagnostic one.
Chrome’s Lighthouse documentation explains how the tool runs and where to use it. We ran Lighthouse repeatedly on our own pages to see how far a score moves with nothing changed, and here is what we found.
How to improve Lighthouse score
Once you understand what the score measures, how to improve Lighthouse score stops being guesswork and becomes a short, ordered list. Work through these in order.
Read the audit list, not just the number. The number on its own tells you nothing about where to start; the Opportunities list underneath it does.
Check render-blocking resources first. Scripts and stylesheets that block the first paint delay everything your visitor sees, so they are a sensible place to begin.
Reduce unnecessary data transfer. Unoptimised images, unused CSS and JavaScript, and oversized fonts add to both the load time and the environmental cost of the page. Reducing what a page transfers and processes supports a faster experience and a lower estimated digital carbon footprint at the same time, though the carbon figure remains modelled rather than directly measured.
Re-run the test after every change, not every session. Testing after one change tells you whether that change worked. Testing after five tells you nothing about which one mattered.
Then check field data, not the lab score, to confirm it worked. A ten-point lab improvement that does not show up in your Search Console field data has not fixed anything your visitors will notice.
Field data is the thing that counts
Field data comes from real visits by real people on real devices, aggregated over a trailing period. In Search Console and PageSpeed Insights, it appears separately from the lab result, and it is what page experience assessment uses.
If the two disagree, believe the field data. A good lab score with poor field data means your test conditions are kinder than your visitors’ conditions, which is common and worth knowing.
The gap is usually explained by the same few things: real devices are slower than the simulated ones, real connections are worse, and real visits encounter third-party scripts behaving unpredictably. The web.dev guidance on Core Web Vitals covers how field measurement works and what the thresholds are.
A field-data-first view of where your own site stands uses the same real-user measurements this section describes, rather than a lab score.
Where a lab score earns its place
It is genuinely good at three things.
Diagnosis. The audit list explains why something is slow, which field data reports but does not account for.
Before-and-after comparison. Because conditions are held constant, testing the same page before and after a change isolates the effect of that change.
Catching regressions. Run in a build pipeline, it flags a deployment that has made things measurably worse.
And accessibility. The accessibility audit catches a portion of common failures, which is a useful starting point provided you understand it cannot confirm a task is completable.
What it cannot tell you
Whether real visitors are having a good time. Only field data answers that.
Whether the page is worth loading at all, a perfect score on a page that buries the phone number has measured the wrong thing.
Which pages matter. Scoring the homepage tells you about the homepage, and your busiest pages are frequently elsewhere. Our guide to improving website load speed covers how to prioritise pages by traffic rather than by convenience.
How to use lab and field data together
Start with field data on your most-visited pages, taken from analytics rather than assumptions. Identify which metric is failing, whether that is Interaction to Next Paint or something further upstream.
Use Lighthouse to work out why, and to test whether a change helped.
Then re-check field data after a few weeks, since it reflects a trailing period rather than the present moment.
Where performance and environmental impact both apply, treat them as the same lever: reducing unnecessary data transfer and processing supports a faster experience while lowering estimated digital carbon, though environmental figures remain modelled rather than directly measured. Our sustainable web development approach builds this in from the first line of code rather than retrofitting it afterwards, and our website sustainability audits start from field data because lab scores can flatter a site.
If your Lighthouse score already looks respectable and you want to know what your real visitors experience, a free website carbon audit will tell you, using the same field-data approach this article recommends, and where a website carbon audit fits alongside a performance review.
For a wider read on why some sites hold both a strong lighthouse performance score and a slow real-world feel, our note on website speed and user experience and the case of a fast website built for a Gloucestershire business both work through the gap in practice.